
Activity Feed › Discussion Forums › GNSS & Geodesy › Bench Mark Stability
Bench Mark Stability
Posted by bill93 on November 8, 2017 at 8:10 pmI??m trying to get a better feel for bench mark stability ratings. The NGS page here is of some help, but doesn??t answer all my questions.
https://www.ngs.noaa.gov/marks/descriptors.shtml#stabilityIn looking at the points used to create Geoid12B in my area, I noticed that poured-in-place concrete posts are called C stability, and precast ones are D. I’d have to see evidence before I believed that was warranted. From what I’ve seen, the precast ones (if they don’t get broken) at least guarantee a length (5 ft?), whereas I??ve seen poured ones out of the ground that aren’t nearly as long and had more irregularities for frost heave to grab onto. Can someone explain the ratings?
And most culverts are only stability C, even though I??d think a large one would be vastly superior to the posts. How deep does a chunk of concrete need to be to rate B?
– – – – – – –
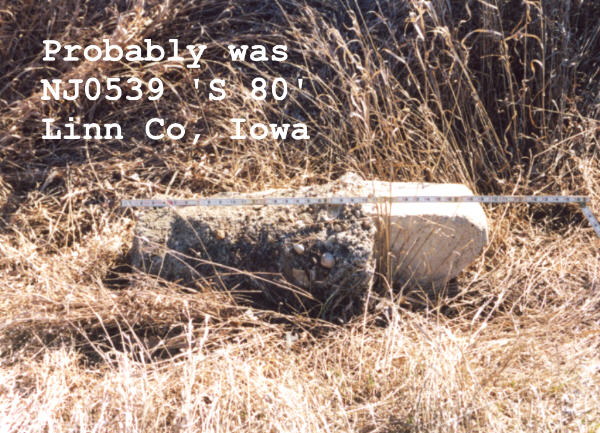
An elevation mark post less than 3 ft overall:
 bill93 replied 6 years, 4 months ago 8 Members · 25 Replies
- 25 Replies

Pour in place monuments generally rest on virgin soil. Precast will depend (at least in part) on fill to hold position.

For Opus submission it’s best to see if they have shifted.

The poured-in-place posts are also belled at the bottom (or at least they’re supposed to be) to resist frost heave.

In 5 years this will be a moot point…

Jim in AZ, post: 454574, member: 249 wrote: In 5 years this will be a moot point
In the meantime, I’m trying to add a few points to the OPUS Share data base that might be used by MGS for checking. There are gaps in the coverage.
But it’s distressing how few have usable sky and those are most often posts.
.Bill93, post: 454583, member: 87 wrote: In the meantime, I’m trying to add a few points to the OPUS Share data base that might be used by MGS for checking. There are gaps in the coverage.
But it’s distressing how few have usable sky and those are most often posts.
A worthy effort but I thought 31 June was the cutoff date for adding data. I could be wrong (usually am)!
thebionicman, post: 454562, member: 8136 wrote: Pour in place monuments generally rest on virgin soil. Precast will depend (at least in part) on fill to hold position.
That would be a consideration for horizontal, but wouldn’t the precast rest on undisturbed soil for height?
.Jim in AZ, post: 454620, member: 249 wrote: I thought 31 June was the cutoff date for adding data
I hadn’t seen that. Is it on the NGS site? Seems like rather early for a project for 2022 release.
.
See: https://www.ngs.noaa.gov/PUBS_LIB/GeodeticBMs/
The NGS description software includes defaults for the variety of monument types. With the inclusion of monument photos it is easier to determine whether deviation from the defaults is justifiable. I Have seen projects where the submitter took the time to override these defaults assuming that their concrete posts are B and not C stability.
I recollect an old colleague,now more than a decade ago, who noticed some rod marks on a project were lacking a punchhole in their tops. He set about to rectify the issue and was shocked to note that the rods were hardly set to ??refusal.? One of the old Field Ops Branch Chiefs would periodically dig out the side of monuments to very they were appropriately set.
Bill93, post: 454625, member: 87 wrote: That would be a consideration for horizontal, but wouldn’t the precast rest on undisturbed soil for height?
The support for pour in place isn’t just on the bottom. The variations along the sides provide resistance to vertical movement as well.
I don’t know what the cut-off date in June meant, I was talking to one of the regional advisors last week and was encouraged to keep submitting.
The main thing I believe is to be sure the Bench mark is stable vertically. To do this means measuring between it and at least one other bench in close proximity. Regionally they may both shift together, but as long as it isn’t a bench that sunk or lifted in place then it would be a good one to share.
A bench can look just great but be 1/2′ or more out of position from construction or many other reasons. These should be avoided.

I have it from a long time friend and colleague at NGS that there will likely be one more hybrid geoid (GEOID18?) to be released. The approximate time line as he provided to me is:
- January 2018 — Produce a prototype model with the new data we have now plus outreach material for it including a prioritized list of marks we want new obs on, and (Brian’s) maps showing the accuracy and difference from GEOID 12B
- Engage stakeholders at state surveying conferences and hold regional discussions on mark prioritization to update old data and fill data gaps – to be held with Advisors and regional partners – by end of February to inform Surveyor’s Week activity in March
- Cut off for new data submissions to be included in new model will be ~Aug 31st, 2018.
- Beta release in December 2018
- Outreach at state surveying conferences in early 2019 to gather feedback and find problems
- Final product release April 2019
Look at the NGS GPS on bench mark map to get an idea of where the greatest needs for new observations in your area are:
http://www.arcgis.com/home/webmap/viewer.html?webmap=e9e8b68a75594c85bd4379e790b5dc08&extent=-149.3895,11.6366,-41.3719,59.0097
Bill
Our regional advisor still promotes GPS on Benchmarks. Unfortunately for us many of the higher stability marks were in significant structures that were on rail lines. Of those few that do remain around the state that are stability A and first order we find they fit with the RTN within an inch vertically as a rule using the current geoid. Without Height Mod leveling I wonder how much value those eighty year old stability C and D marks actually have in our area, A person with NGS who should know told me he is confident in the current geoid model in our state at the 1-2 cm level. I would not disagree with his assessment given the results we’ve have seen on stability A first order marks. We’ve also seen lower stability and lower order marks that don’t fit very well.I??ve also lamented the difficulty of finding good stability marks that aren??t either next to an active rail line, surrounded by trees, or both. Bridges and culverts are very often over tree-lined creeks. More trees if the rail line is abandoned. I’ve looked at every mark location that may still exist in a 50-mile strip on Google Earth and looked in person at the ones that might be viable, to come up with 3 in the list below.
I have several OPUS sessions (mostly 6-hour) that are or could be shared, five of which could be worthwhile contributions to the GPS on Benchmarks program because of their distance from any Geoid12B constraint point.
But I noticed a trend in my measurements according to type of mounting that worries me and prompted me to start this thread. I tabulated the height determined by GPS minus leveled ortho height, sorted by the magnitude of difference.
Diff = (Ellip ??Geoid12B) – OrthoLev
[PRE]
Diff, mm Stability Type Nearest Geoid12B pt
+1 B Large abutment (Reset) 16 km
+4 C Poured post 60 km
+11 C Poured post 0
-15 C Poured post 44 km
-32 C culvert headwall 43 km
-43 C culvert headwall 44 km
-44 D Medium culvert 38 km
[/PRE]
I have no idea why that last culvert would be rated D as it is of medium size and in place for 24 years before the disk was added. The other culverts are not quite as big, but are much larger than a post.The worrisome thing is that all of the larger chunks of concrete measured well below predicted values. Several explanations for the large differences could be considered, some of which I don??t believe:
1) Random variations in measurement, poor roll of the dice. If repeated, the measurement might be that much high next time. It was a coincidence that all the culverts happened to measure low.
2) The culverts have settled that much more than posts despite having been there for decades before the disks were set.
3) Blunder in ARP height measurement process, despite having checked several points against other people??s measurements (see HARN point in table).
4) Many concrete posts have raised slightly due to frost and this led to the geoid model, which relied on a lot of posts, being defined too high.
5) Since the culverts were in gaps of prior GPS coverage, the geoid model was poorly constrained there and the model is really that far off.
Thoughts?
.Interesting data. Keep in mind geoid development also relies on gravity data obtained statewide from the air. I’m not sure how much the post GPS data enters into the model. I do know the model works fairly well with modern leveled differences – many times better than the old marks work with each other.
linebender, post: 455215, member: 449 wrote: geoid development also relies on gravity data obtained statewide from the air
That’s GRAV-D that will be used in future geoid models, but is there any airborne data in Geoid12B ?
.Bill93, post: 455217, member: 87 wrote: That’s GRAV-D that will be used in future geoid models, but is there any airborne data in Geoid12B ?
See: https://www.ngs.noaa.gov/GEOID/GEOID12B/GEOID12B_TD.shtml. It does not refer to any GRAV-D data being used.
linebender, post: 455199, member: 449 wrote: he is confident in the current geoid model in our state at the 1-2 cm level
If I recall your state, it is mostly green on the Geoid12B map that Dave linked above.
I’m trying to attack the streak of red marked with the arrow in the following picture, and three of the points tabulated above fall in or beside it. My green circles would fall just short of Illinois, leaving a yellow tip. I also need to do a session on a culvert just east of that streak as a check.
Two of the points tabulated above are near the southern tip of the streak to its west, which along with the GSVS14 study should eliminate the red there. I’ve done some looking for marks near that blob in south central Iowa, not too far from my home town, and have a couple ideas for sessions but they are difficult (need rather tall antenna pole) or risky (20 ft from very active track).
 .
.I shouldn’t be using words like “eliminate red” because my data won’t actually be used in a new geoid. But it could provide checking in an area that needs it, so I think in terms of covering those areas with circles.
.At the 95% confidence level no state (or territory) has a 1-2 cm geoid uncertainty with GEOID12B. In general even in states where the model performs at its best NGS still estimates the uncertainty at 3-5 cm level. If you look at the GEOID12B tool https://www.ngs.noaa.gov/cgi-bin/GEOID_STUFF/geoid12B_prompt1.prl and enter any random lat/long the utility will provide the geoid height and the uncertainty estimate at the 95% level. Regrettably NGS does not provide that figure for published points, you have to perform the computation yourself. I would highly recommend relaying on NGS’s estimates.
Log in to reply.