
Activity Feed › Discussion Forums › GNSS & Geodesy › Residuals plot
Residuals plot
Posted by geodesist on January 8, 2021 at 4:20 pmHello, Dear colleagues
Please I need your help,
Could you tell me, what’s the interest and why we use the Residuals plot (for statistical study).
Thank you
Cordially
mike-marks replied 3 years, 3 months ago 5 Members · 8 Replies- 8 Replies
It tells you the amount and direction that your control is weakest in. You can use this info to tighten up your control network if the residuals are too high.
—Dan MacIsaac, PLS
Plots of the residuals primarily assist in analysis of a least squares solution and blunder detection. Histograms will show skew and clusters of residuals. Ideally, systematic errors and blunders will not be present in the dataset, leaving you with random error, which in theory should plot as a normal curve. There are some methods to calculate a theoretical cut-off for maximum acceptable size of the residuals, which you can use to decide whether to accept an observation, or remove it from the dataset and re-run the adjustment.
However, standardized residuals (rather than the raw residuals) are generally more useful for determining whether or not an observation is likely a blunder. There are a couple of methods available, such as data snooping and the tau criterion, for computing the cut-off point.
XyHT had an excellent 4-part series on the subject. Here’s the first one (has links to the rest of the series at the bottom):
https://www.xyht.com/surveying/methods-analyzing-data-part-1/
“…people will come to love their oppression, to adore the technologies that undo their capacities to think.” -Neil Postman
I could not find the post by Jim Frame but a good example of the utility of plotting data is here:
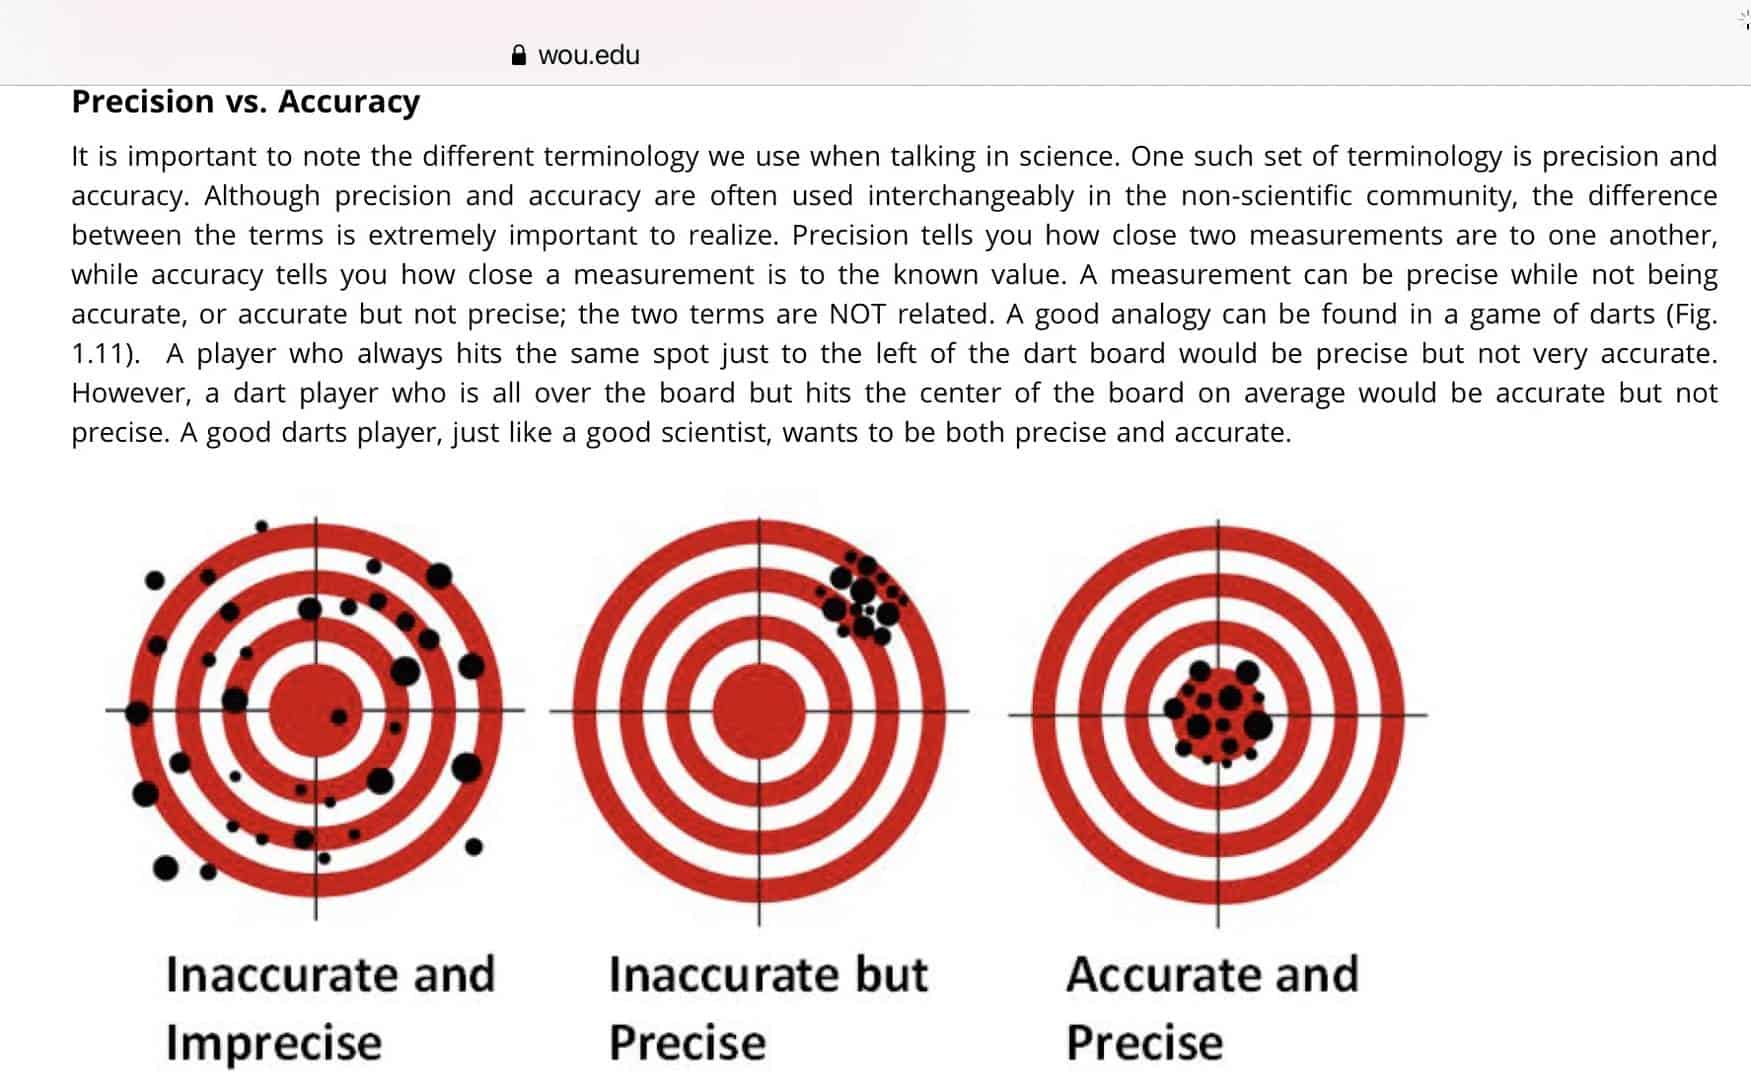
Outlier detection is greatly simplified via the use of graphs. In GPS data processing high-end tools include residual plots to analyze data and detect outliers. While detecting and fixing cycle slips are highly automated nowadays, in the ??old days? we had to manually (creating an edit file) fix cycle slips.
As for the the topic of the statistics of residuals, I recommend:
https://geodesy.noaa.gov/library/pdfs/NOAA_TR_NOS_0065_NGS_0001.pdf – Allen J Pope paper.
The source of the graphic (that also includes a good discussion of precision v accuracy) is here:
HTH,
DMM
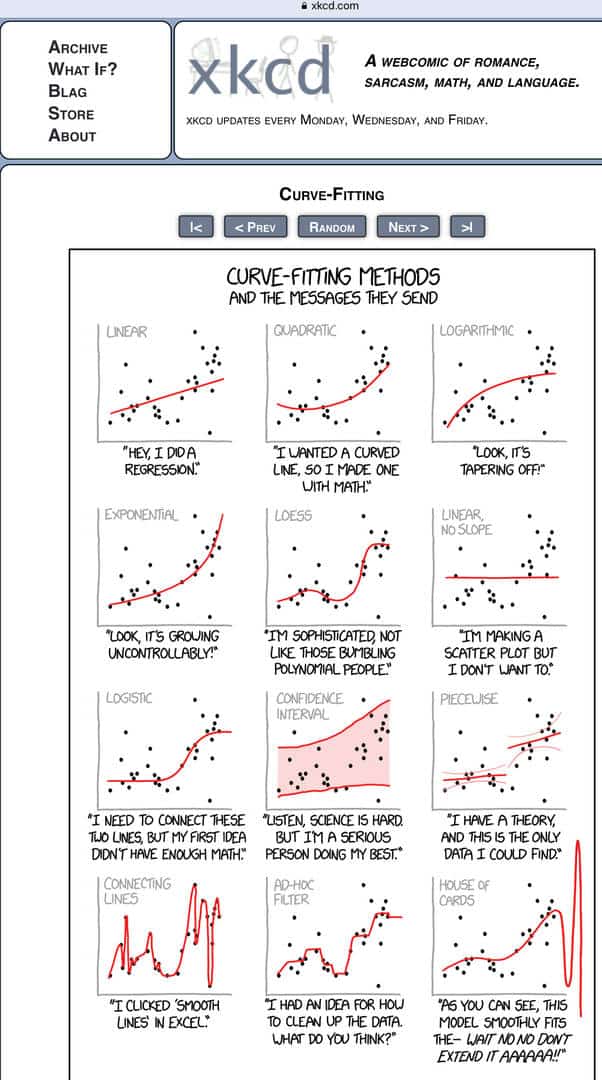
Another example of the utility of plotting from XKCD…

@geeoddmike Thank you for your valuable help. Really much appreciated
 Posted by: @rover83
Plots of the residuals primarily assist in analysis of a least squares solution and blunder detection. Histograms will show skew and clusters of residuals. Ideally, systematic errors and blunders will not be present in the dataset, leaving you with random error, which in theory should plot as a normal curve. There are some methods to calculate a theoretical cut-off for maximum acceptable size of the residuals, which you can use to decide whether to accept an observation, or remove it from the dataset and re-run the adjustment.
However, standardized residuals (rather than the raw residuals) are generally more useful for determining whether or not an observation is likely a blunder. There are a couple of methods available, such as data snooping and the tau criterion, for computing the cut-off point.
XyHT had an excellent 4-part series on the subject. Here’s the first one (has links to the rest of the series at the bottom):
https://www.xyht.com/surveying/methods-analyzing-data-part-1/
That graphic example works great if you have one angle/distance blunder and can isolate the problem to a single observation & reobserve, been there done that. Not so much if several stations are suspect in a traverse. The great advance that network observations (thanks to EDMs) provide is an adjustment where one station (or several) sticks out as a stinker and needs re-observations. Or, perish the thought a first order control station is BS and if you ignore it your network is golden.
It’s a new world where distant GPS translocation can distort local accurate transit & tape surveys to where they’re a few feet off and your neighbor owns 3 feet of your driveway. I still hold record monuments but where there are none it appears the GPS guys win out because of superior accuracy from section corner a half mile away.


Log in to reply.