
Activity Feed › Discussion Forums › GNSS & Geodesy › Transforming NAD 83 to present day GPS
Transforming NAD 83 to present day GPS
Posted by ashton on September 19, 2021 at 3:29 pmI’m an aerospace education officer and involved in search and rescue with the Civil Air Patrol. I have one member who claims drones can achieve accuracy in the millimeters. Maybe the high-end setups with multiple-frequency receivers and real-time corrections against one or more reference stations could do a lot better than the typical hand-held hiking GNSS unit, if not millimeters, but certainly not the setup he’s using.
We agreed that we would observe some NGS monuments to establish what our equipment is capable of. Equipment includes
- drones (that I’m not very familiar with)
- Garmin eTrex (yellow, so old it doesn’t have a number)
- Garmin eTrex 20 (personal equipment)
- Nikon D7100 with Solmeta GPS attachment
- various personal smart phones with cameras
- Motorola APX 4000 radios with build-in GPS that can display lat/long on the handheld radio.
My question: I know that the NAD 83 NGS datasheet positions shouldn’t be directly compared with GPS positions, and they can be transformed using NGS’s HTDP software. One mark, OD0251, has the following horizontal position line:
OD0251* NAD 83(2011) POSITION- 43 29 32.16709(N) 072 58 22.77824(W) ADJUSTED
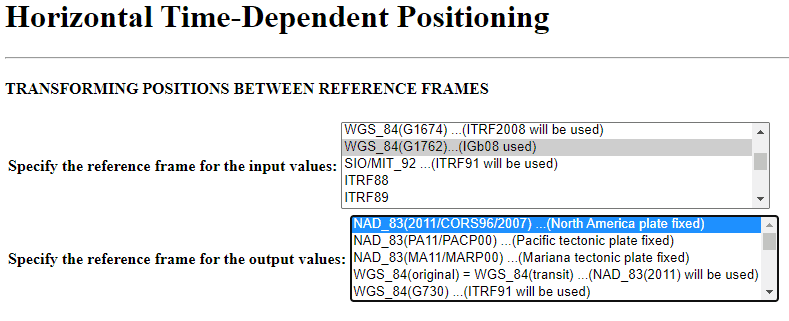
This is available directly as the “from” reference frame in HTDP. Assuming the GPS observations are made this year, what should the “to” reference frame be? The closest I could find was ITRF 2014.
I realize the correction will only be on the order of a meter, which is on the same order of magnitude as the uncertainty of position of the best passive marks. But I want to be able to show the program output to anyone who is claiming millimeters.
This, of course, is academic. One doesn’t need accuracy to millimeters to find a crashed plane or a lost person.
loyal replied 2 years, 7 months ago 8 Members · 20 Replies- 20 Replies

There isn’t really a question here…..
 Posted by: @mark-mayer
There isn’t really a question here…
I don’t see a question either…
But if someone is looking to use the above referenced NGS mark for what (I think?) is a test of coordinate accuracy, they’re going to have a hard time proving millimeters when the NGS datasheet clearly states that network and local accuracies of the published coordinates are well above a centimeter:
 OD0251  Accuracy and standard deviation values are given in cm.
 OD0251
 OD0251  Type/PID  Horiz  Ellip  Dist(km)  SD_N   SD_E   SD_h         CorrNE
 OD0251  -------------------------------------------------------------------
 OD0251  NETWORK   1.37   1.88             0.63   0.46   0.96    +0.17867556
 OD0251  -------------------------------------------------------------------
 OD0251  LOCAL (002 points):
 OD0251  OD1249    1.34   1.82     5.04    0.62   0.44   0.93    +0.21980468
 OD0251  OD1796    1.36   1.76    28.29    0.62   0.47   0.90    +0.07366315
 OD0251
 OD0251  MEDIAN    1.35   1.79    16.66
 OD0251  -------------------------------------------------------------------
“…people will come to love their oppression, to adore the technologies that undo their capacities to think.” -Neil Postman
@mark-mayer The question is, what reference frame should be the “to” reference frame in HTDP?
@rover83 Agreed, if one had a GNSS receiver that under the right conditions was capable of millimeters, one couldn’t prove it by making observations on this mark. But if someone claims that the eTrex teenager is capable of a few meters and the measurement is 80 meters off, the claim is disproven.

I wrote an American Surveyor article that was published in March 2015. Unfortunately it may be one of these evergreen articles that can be used over and over. Like in a week or two…
In any case it shows exactly how run HTDP. Here is a link to the archived PDF:
https://archive.amerisurv.com/PDF/TheAmericanSurveyor_Silver-GeodeticPreppers_March2015.pdf
I was under the impression that this was about drones and millimeters rather than Garmins and tens of meters.
To answer your question about datums, you probably want to use ITRF2014 and current date for output datum & epoch. ITRF2014 and WGS84 (at least, equivalent realizations at same epoch) are effectively identical, and are what pretty much all recreational-grade receivers are outputting. There may be a couple that can do on-the-fly transformations but I can’t think of any off the top of my head.
“…people will come to love their oppression, to adore the technologies that undo their capacities to think.” -Neil PostmanI’m not at all certain about this…. but autonomous positioning from GPS will be WGS84, the latest realization of which is WGS84(G1672). So that would be your “from” for an autonomous position. The “to” is the North American plate realization of NAD83(2011). Or maybe you are looking to do the reverse? Nevertheless, the shift between those two will be trivial compared the error in autonomous positioning.
But it seems to me that you are trying to fix stupid. That can’t be done. When you wrestle with that pig you both get dirty. The difference is that the pig likes it.
Noting that the NGS Control points have stated errors well above the millimeter level would seem, to me, to be sufficient proof that positioning to the millimeter is not a simple task.

Interesting problem. First, about the equipment, those old, old Etrex receivers came in two versions; one with WAAS and one without. The one I have is without WAAS, so it consistently under-performs newer receivers. Also, the Garmin output is rounded to tenths of a second, so a perfectly correct internal reading will display with roughly +/- 5 feet accuracy due to rounding. You can get more decimal places by downloading the reading to something like ExpertGPS, but inaccuracies caused by the limitations of the receiver will not be eliminated.
For HTDP, I would convert NAD83 to WGS84. Your data sheet says that the NAD83 coordinates were determined in June, 2012, so I used 6-15-2012 as the input date. Then used today’s date, 9-19-2021 as the output date. That way, I have computed the value that I expect the receiver to show. The result is below:
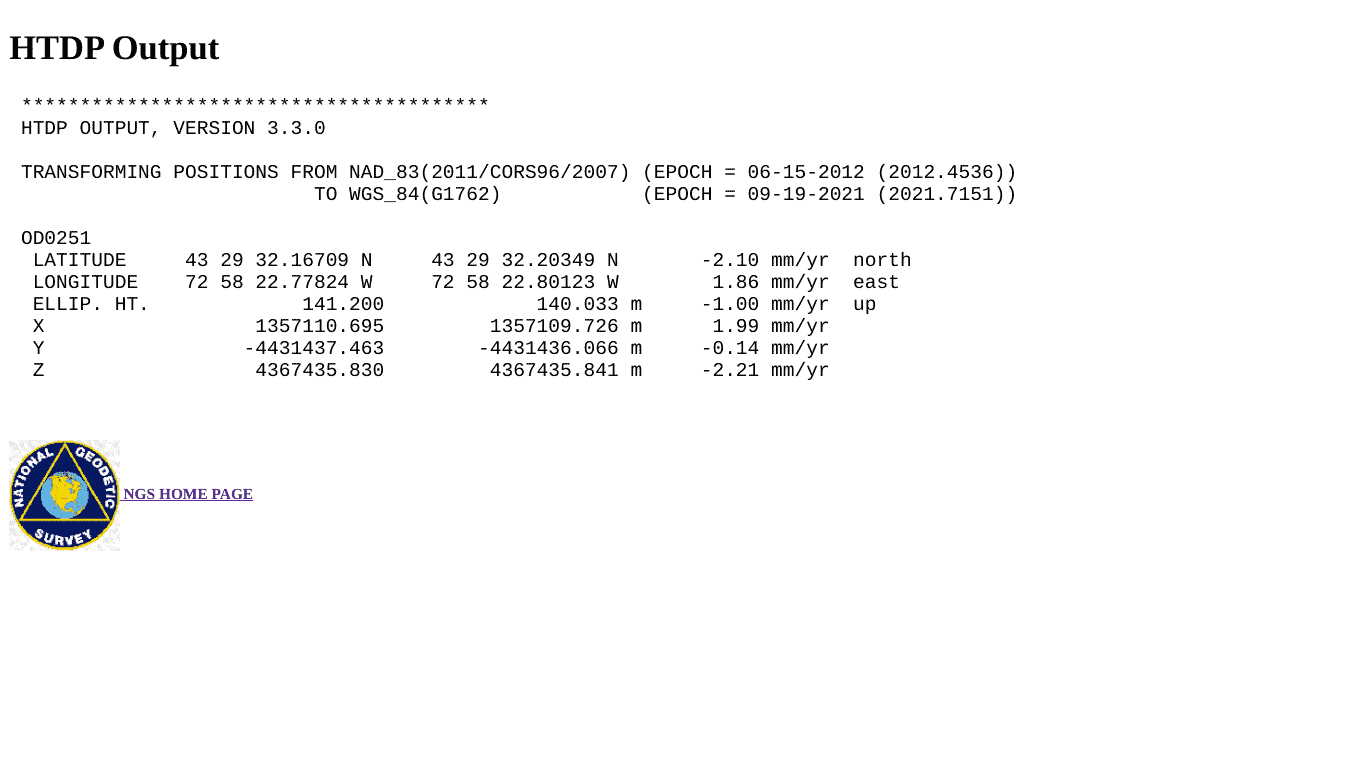
Note that, rounded to tenths of a second, there is no change, so the Garmins won’t detect any difference other than their own error.
Your member should do some math with a simple spherical earth to verify the length of a second of arc in feet or meters. That fifth decimal place in the NGS figures is about 0.3 mm which he can verify with minimal effort.
Even so, I would definitely go on with the experiment.
@mathteacher I see that the GPS observations and adjustment was done June, 2012. But I also see that the epoch is 2010.00. I don’t know whether the adjustment process made a best estimate of where the mark was on January 1, 2010, or June 27, 2012. Of course, the difference is probably very small, but it would look neater to use the right date.
The point is continuously moving southeast and sinking with about 3mm per year displacement, so the start date does matter if one expects millimeter-level accuracy.
A little further research turned up this quote: “The epoch date indicates that the published coordinates represent the location of the control stations on January 1, 2010 ?? an important consideration in tectonically active areas (such as the western U.S.). In this way, the CORS coordinates (and thus the passive marks constrained to the CORS) are consistent across both space and time. Additional information on the MYCS1 realization of NAD 83 is available on the NGS CORS Coordinates web…” from The National Adjustment of 2011 Project on the NGS web site.
So it looks like the proper start date is 1-1-2010. Additionally, you should heed Mark Mayer; the network accuracy is in centimeters, not millimeters, so even NGS would not state accuracy to the level that your member claims.
 Posted by: @mathteacher
The point is continuously moving southeast
Points in the US are moving West or NW, so the same WGS coordinate numbers will refer to a point on the ground SE of what they previously did.
.
The only GPS actually measuring to millimeters globally will be fixed stations like CORS.
I’ve encountered many who believe outlandish accuracy about GPS. Its like chashing cats. I simply ignore it, that’s my advice.
Sorta. If you look at the velocities on the HTDP output, North is negative, East is positive, and Up is negative. I interpret that to mean that the vector is Southeast and Down.
Interesting…especially since by the time the HARN realization(s) was/were out in the 90s, NAD83 and WGS84 were already substantially different, by several feet. I guess the thought process was that since the recreational-grade receivers usually don’t get you much better than 1-3 meters (and considerably worse before SA was turned off), any actual transformation wouldn’t really be noticeable. Makes practical sense, but still odd.
“…people will come to love their oppression, to adore the technologies that undo their capacities to think.” -Neil PostmanThere is a way to get the best number.
Two high quality tribrachs, tripod legs, and two high quality receivers.
Make sure both tribrachs are adjusted as tightly as possible.
Set one receiver over the point, collect 24 hours of data and save the file, measuring the HI to the proper point on the receiver in feet and meters.
Repeat with the other tribrach and receiver.
Wait a week or so for the best data to become available.
Using a high end processor, process the point with data provided by surrounding CORS stations.
Then adjust the two sets of numbers using a least squares program.
Then you may have a snapshot of that point in that time frame to a few millimeters,,,,,,,,,,,,maybe.
Be sure and find the latest possible updated coordinates for each CORS station.
You may also send the files to OPUS but it’s my understanding that OPUS uses datasheet numbers for their processing (I don’t care about that at all, but you seem obsessed with it).
That’s how it’s done, Good luck.
Understand that all the adjustment programs are really good, but they are not based on updated observations for the point.
@mightymoe I’ve encountered folks who stick to this or that belief, and I realize it’s typically a waste of time to try to change their mind. But the member in question is enthusiastic about making observations of NGS marks and seeing what the results really are. I think this is a case of a person who only heard the myths and has never been exposed to rigorously developed information. The technical education I know of for this member is the pilot licensing process.
I will tell you to let go of finding that perfect number. Use the 2012 number it will work for what you need.
I got into a silly argument over the top of the Washington Monument with a “senior engineer” some years ago. He insisted that the unit on the monument was accurately measuring the monuments position from satellites. I tried to explain that it needed to be tied into the NGS system of points to get an accurate number. He actually got offended that I would even suggest such a thing.
It opened my eyes to how much disinformation is out there and how time-consuming it can be to correct.
Personally, I encourage observing NGS marks with whatever equipment you have. Visit the same mark on different days and see how the recreational GPS readings vary. In fact, it’s instructive to see how the readings vary over 10 minutes or so. Just place the receiver on the mark and watch the coordinates bounce around for 10 minutes. These receivers were not designed for precise work.
The math teacher in me requires an analytical problem. Consider three NGS marks arranged like this:
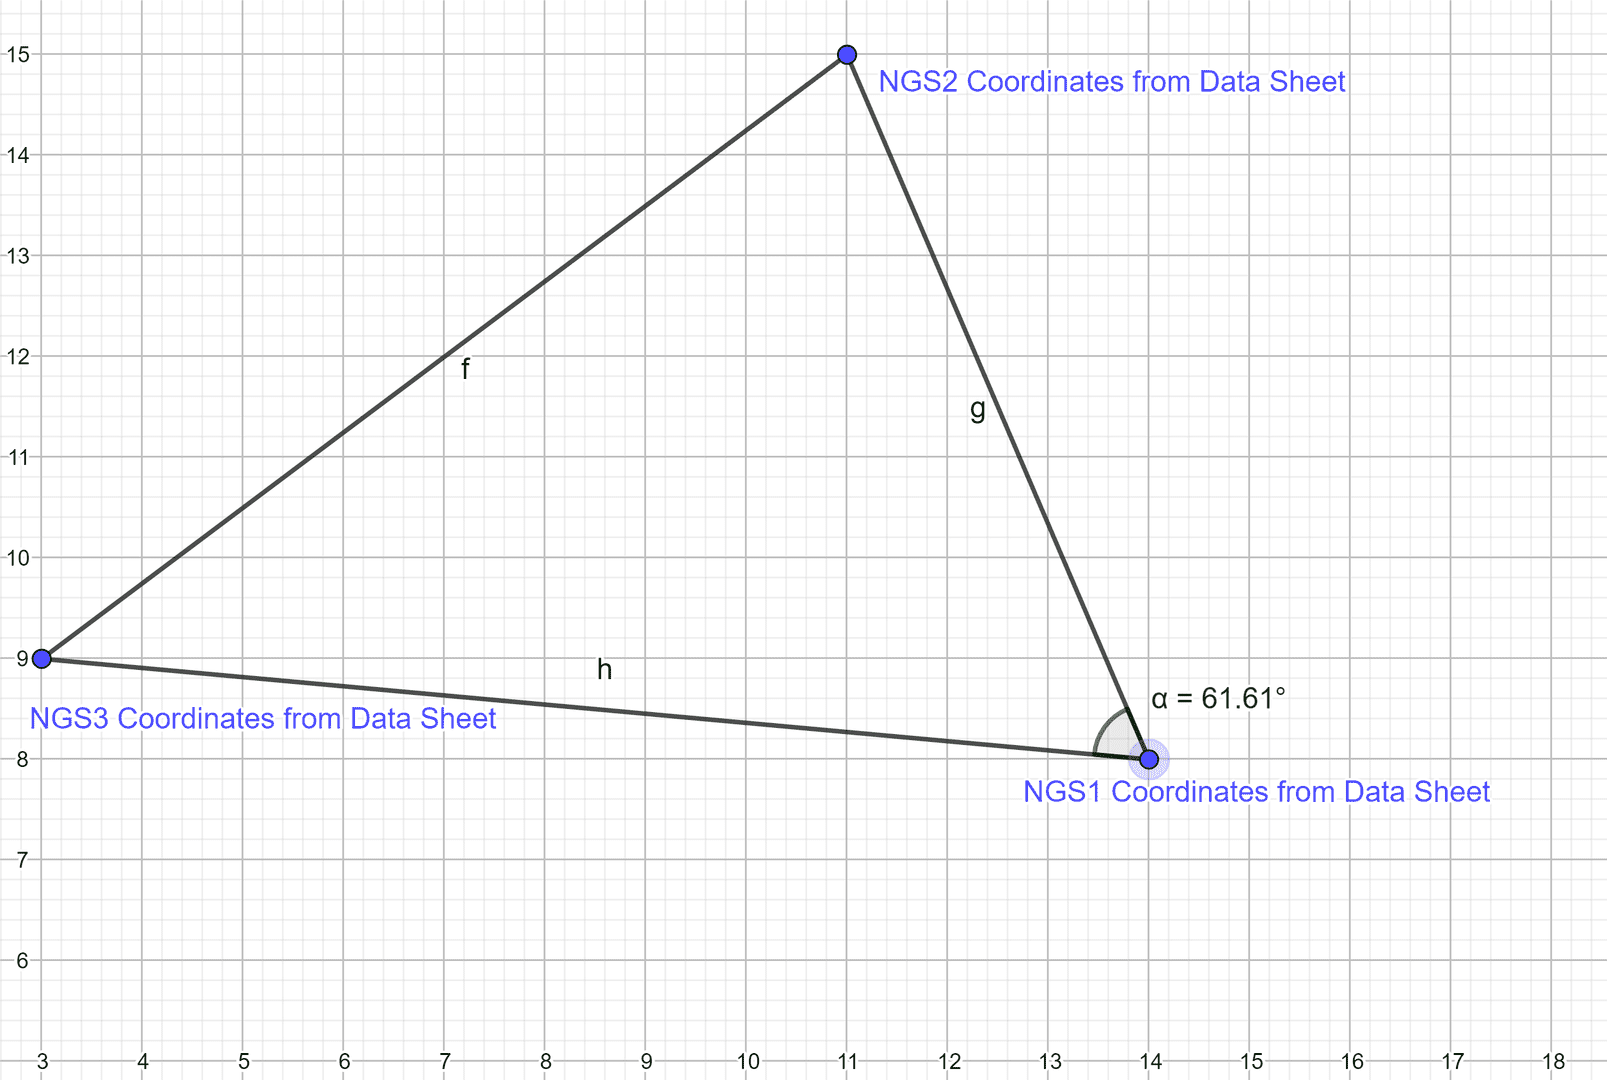
1) Use the State Plane coordinates on the data sheets to calculate the lengths of the sides of the triangle and the Law of Cosines to calculate the angles.
2) Use the NGS Geodetic Tool Kit to calculate the same quantities. Compare the results with those in (1). This will illustrate the difference between coordinates on a plane and their corresponding coordinates on an ellipsoid.
3) Repeat Geodetic Tool Kit exercise, but round all coordinates to coordinates to one tenth of a second. This will illustrate one of the problems that drones and ground-based surveyors have to contend with.
Tell him if he doesn’t do these exercises, he’s getting a lump of coal in his Christmas stocking. Then tell him that he gets an additional Almond Joy in his stocking if he also completes this one:
4) Go to the FCC database and find the coordinates for three communications towers near him. Repeat Exercise (2) for the triangle these points make. Estimate the error in distances caused by insufficient significant digits in the FCC coordinates.

The ITRF
A .pdf file outlining what the ITRF “is” and where it comes from (and where it is going).
https://www.iau.org/static/science/scientific_bodies/divisions/a/2018/Altamimi.pdf


Log in to reply.