
Activity Feed › Discussion Forums › Software, CAD & Mapping › Linear Regression with Ordinary Least Squares
Linear Regression with Ordinary Least Squares
Posted by field-dog on December 4, 2021 at 12:25 pmI’m learning the best fit line routine using Carlson Survey 2021 to check for right-of-way widths for sidewalk staking. I don’t like pressing buttons without knowing what the routine is doing. I learned how to do scatterplots in college using a graphing calculator. To my knowledge this should be similar to what Carlson does, but on a simpler level. I was watching a YouTube video to review scatterplots, and I made a comment
I need to relate the data points to the best fit line in terms of land surveying where the data points are
perpendicular to the best fit line. This is true for land surveying where the data points represent property
corners and would be left or right of the best fit line. Your video shows the data points directly south (Y-axis)
of the best fit line. How do I relate your example to my needs?I brought a Carlson best fit line report home with me, and I want to compare that report to something that I would create. I did not use the <0> option to add weight to any particular point.
dave-karoly replied 2 years, 2 months ago 20 Members · 61 Replies- 61 Replies

I’m a bit confused here, so help me understand. When you do a linear regression line of best fit, you’re minimizing the sum of the squares of the perpendicular distances from the data points to the line of best fit. Therefore, the points are always “perpendicular” to the line. (A point can’t be perpendicular to anything, but one of the many lines that can be drawn from a point to the line of best fit is perpendicular to the line of best fit.)
Also, I would like to see a line of best fit that has all of the data points below it. A mathematical constraint of a linear regression line is that it passes through the mean of the data points, so there should always be at least one point on the opposite side of the line from the others. Could you share the link to the video that you saw?
Are you finding the best fit of redundant measurements of the corners, or are you finding the best fit straight line from one corner to another?
Draw us a simple diagram, nothing fancy, just enough for this non-surveyor to visualize the problem.

I thought the standard linear regression minimized sum of squares of the distances from points to line in the Y axis direction. If you reverse the roles of X and Y you get a different line. More greatly different for data less correlated.
Best fit on perpendicular distances would be of interest in surveying but I don’t recall seeing it treated in statistics books. Intuitively, I would expect that line to be between the y-based fit and the x-based fit lines.
. Posted by: @mathteacher
(A point can’t be perpendicular to anything, but one of the many lines that can be drawn from a point to the line of best fit is perpendicular to the line of best fit.)
Thanks for the real explanation, it reminds me of the worst lame (but they do close) metes and bounds legal descriptions which describe a line terminus as a “point”. There is no such thing as a “point” (mathwise) in surveying descriptions. Linear regression is mostly used in R/W boundaries but can lead to big problems if not incorporating all found monuments. ????
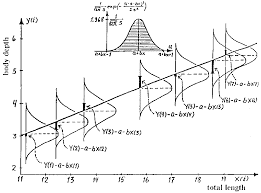
You’re correct about the y-difference rather than the perpendicular distance. I knew that, but I’ve been off working with some analytic geometry problems where it was the other way round. It’s supposed to work like this:
I’ve never been sure about how such a line would be calculated with survey data and I’m not sure what its purpose is. Are we trying to see if a group of measured points are collinear, or the accuracy of individual points, or something else?

Field Dog, good to hear you are trying to learn. For your problem you would want to read from CRC Concise Encyclopedia of Mathematics, 2nd edition by Eric W. Weisstein. Read, starting on page 1717; Least Squares Fitting. At the bottom of page 1717 and on the next page you will start the Math that you will need to know to understand “HOW” to solve for the LS fitting of the perpendicular offsets. (The article ends on page 1721).
Hope this helps
JOHN NOLTON
 Posted by: @mathteacher
Could you share the link to the video that you saw?
3.2: Linear Regression with Ordinary Least Squares Part 1 – Intelligence and Learning
https://www.youtube.com/watch?v=szXbuO3bVRkPosted by: @mathteacherAre you finding the best fit of redundant measurements of the corners, or are you finding the best fit straight line from one corner to another?
The later. Carlson Survey 2021 calculated the following, holding Pts. 248 and 254 as end points:
Pt.: 248 Wt.: 1 Offset: 0.24655 RT
Pt.: 249 Wt.: 1 Offset: 0.24033 RT
Pt.: 251 Wt.: 1 Offset: 0.78342 LT
Pt.: 252 Wt.: 1 Offset: 0.06476 RT
Pt.: 254 Wt.: 1 Offset: 0.23177 RT
MHI haven’t studied these pages, butthey are on point for this thread.
https://mathworld.wolfram.com/LeastSquaresFittingPerpendicularOffsets.html
https://www.toddreed.name/articles/line-fitting/
.
I presume you have located property monuments and want to use a best fit line calculation? Why? Why have software determine the r/w line? To call all points ??offline, which is a best fit, is reprehensible. Make and use your own calculation. Some points will be off by a bit and they shouldn??t be considered.
 Posted by: @robertusa
Why have software determine the r/w line?
It may be just an exercize, and not an actual deliverable product. Sounds interesting
@field-dog I bought the book (2nd Edition) when it first came out (2003?). I see the 3rd edition, 3 vol. is over $750
I might have to think about that. Dave Lindell also has the book and knows all about what you are doing. I was hoping either he or Math Teacher would post on what I gave reference to.
Notice that one of the offsets is left and the other 4 are right, so they are not all on one side of the line. Note also that, if you add them up making the left negative and right positive, they sum to nearly zero. Thus the mean of the offset distances is zero and the line passes through the mean coordinate value.
As to the perpendicular, horizontal or vertical offset, it could be any of these. Consider this from Microsurvey: Line – Distance Offset (microsurvey.com)
I didn’t find similar stuff for Carlson, but it seems likely that Carlson has a setting as Microsurvey does.
If you give us the measured coordinates, we may be able to determine which it is.
Also, a heckuva nice and smart PhD professor at UNC taught me how to use Excel to do a wide variety of least squares calculations as we were discussing and calculating Covid spread models. Perhaps I could use that with your data and help us all learn something new.
I have located the property monuments and I want to use a best fit line calculation to determine if the calculated R/W widths match the plat R/W widths. I’m interested to know how you would approach the problem.
MHIf you don’t find an easy way to solve the perpendicular fit, rotate all your bearings so the (jagged) line is nearly parallel with the x axis and use the common formulas. The difference in results will be negligible.
.- Posted by: @mathteacher
Perhaps I could use that with your data and help us all learn something new.
Excellent!
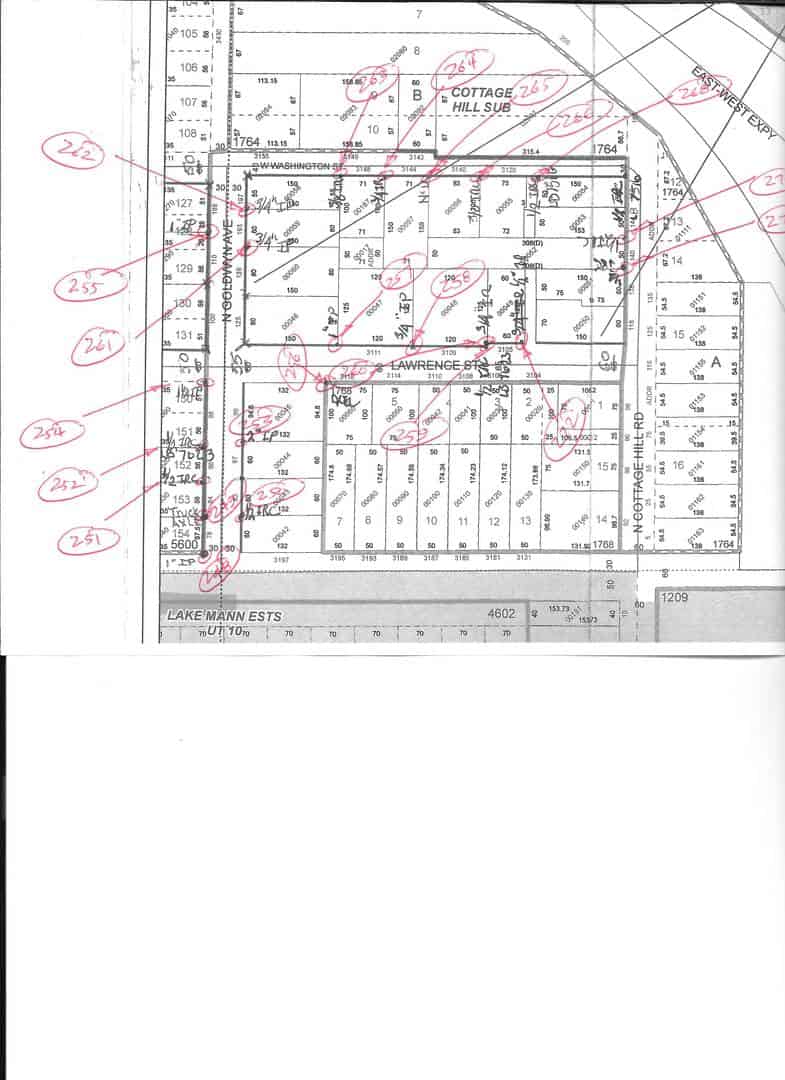
Please note that I want to check the R/W width (60′) between the platted W. side lots (150 – 154) and the
unplatted E. side lots (parcels 00042 – 00045) along N. Goldwyn Ave.MH I only see 7 points in your txt file (.csv file under another name) and only three of them fall near one possible straight line and three near another possible straight line. Point 251 is far from either. The lines, if I have correctly identified them, make a considerable angle far from being parallel, so the distance between them changes by more than 50 units (feet?).
I don’t think this is a problem for statistics.
. Posted by: @robertusa
I presume you have located property monuments and want to use a best fit line calculation? Why? Why have software determine the r/w line? To call all points ??offline, which is a best fit, is reprehensible. Make and use your own calculation. Some points will be off by a bit and they shouldn??t be considered.
Do you place angle points in the ROW line at every recovered monument on your records of survey?
“…people will come to love their oppression, to adore the technologies that undo their capacities to think.” -Neil PostmanI’m sorry that my leader arrows are confusing (points 251, 252, and 254). The arrows are pointing to the descriptions of those points. I was trying to avoid crowding the plat. All points on the W. side of N. Goldwyn Ave. fall close to the R/W line. The csv file purposely contains only points 248 – 254.
MH


Log in to reply.